
Một hệ thống phân tán dù được thiết kế với Clean Architecture hoàn hảo đến đâu, nếu thiếu đi khả năng giám sát, cũng giống như một con tàu ngầm di chuyển trong đêm tối vô tận. Bạn không thể tối ưu những gì bạn không thể đo lường.
Bài viết này không chỉ dừng lại ở mức "How-to", mà sẽ đi sâu vào "Why" và "How it works under the hood", mang đến góc nhìn chuyên sâu về Prometheus — mảnh ghép không thể thiếu trong bức tranh Observability của các hệ thống Backend hiện đại.
# bản chất
Khác biệt cốt lõi nhất của Prometheus so với các giải pháp như InfluxDB hay Datadog nằm ở triết lý thu thập dữ liệu: Pull-based (Scrape) thay vì Push-based.
Hệ thống của bạn không cần phải "kêu gào" gửi dữ liệu đi. Các services chỉ cần lẳng lặng bộc lộ (expose) trạng thái của mình qua một HTTP endpoint (thường là /metrics). Prometheus sẽ theo định kỳ đến "hỏi thăm" và mang dữ liệu về lưu trữ tại Time-Series Database (TSDB) nội bộ.
Độc lập & Tối giản: Target không bị ràng buộc với hệ thống giám sát. Nếu Prometheus sập, target vẫn hoạt động bình thường, không tốn tài nguyên cho việc retry push data.
Dễ dàng Debug: Bạn chỉ cần mở trình duyệt và truy cập /metrics của một service để xem nó đang bộc lộ những gì, không cần công cụ rườm rà.
# kiến trúc
Prometheus tuân theo một luồng xử lý cực kỳ mạch lạc và phân tách trách nhiệm rõ ràng:
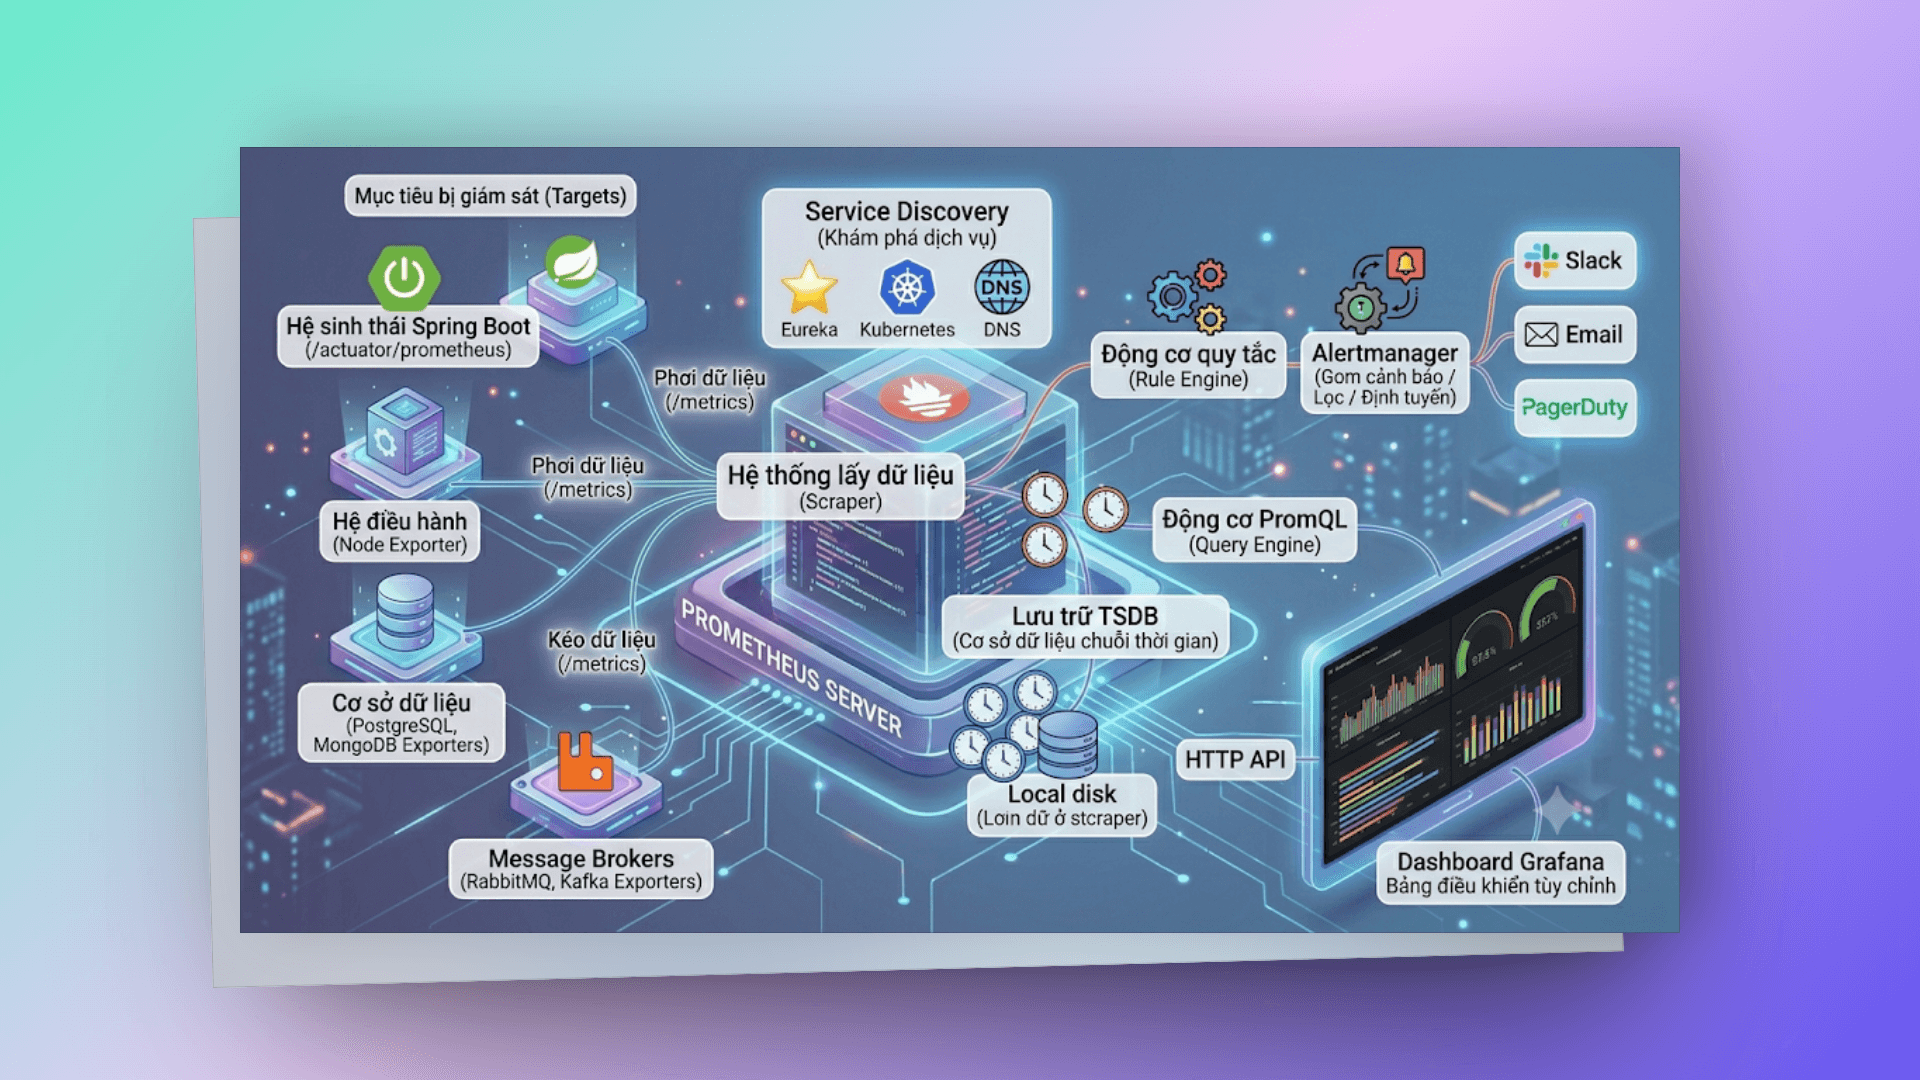
Kiến trúc này mô tả luồng hoạt động cốt lõi của máy chủ Prometheus, được chia thành các thành phần chính sau:
- Service Discovery: Thành phần này chịu trách nhiệm tự động tìm kiếm các dịch vụ mới và đang hoạt động để Prometheus có thể theo dõi. Nó sử dụng các nguồn dữ liệu như Eureka, Kubernetes (K8s), DNS,... để liên tục cập nhật danh sách các mục tiêu. Điều này cho phép Prometheus tự động mở rộng và thu hẹp khi các dịch vụ được thêm vào hoặc loại bỏ khỏi hệ thống.
- Scrape Targets: Dựa trên danh sách từ Khám phá dịch vụ, Prometheus kéo (pull) các số liệu đo lường (/metrics) từ các mục tiêu đã được xác định. Quá trình này được gọi là "scrape". Mỗi mục tiêu cần phơi bày một điểm cuối HTTP (thường là /metrics) ở định dạng mà Prometheus có thể hiểu được. Số liệu được kéo định kỳ, và đây là một đặc điểm quan trọng - Prometheus chủ động thu thập dữ liệu thay vì đợi các dịch vụ gửi dữ liệu đến.
- TSDB Storage: Dữ liệu số liệu đo lường được thu thập sau đó được lưu trữ vào Cơ sở dữ liệu chuỗi thời gian (Time-Series Database - TSDB) trên Đĩa cục bộ. TSDB là một loại cơ sở dữ liệu được tối ưu hóa cho dữ liệu chuỗi thời gian, cho phép Prometheus lưu trữ và truy vấn khối lượng lớn dữ liệu số liệu đo lường một cách hiệu quả. Dữ liệu được lưu trữ dưới dạng các điểm dữ liệu liên tiếp theo thời gian cho từng số liệu đo lường.
- PromQL Engine: Thành phần này là trái tim của việc truy vấn dữ liệu. Nó cho phép người dùng viết các truy vấn phức tạp bằng ngôn ngữ PromQL (Prometheus Query Language) để phân tích và trích xuất thông tin từ TSDB. Các truy vấn PromQL có thể được sử dụng để tính toán tỷ lệ, tổng hợp dữ liệu theo thời gian, phát hiện bất thường, v.v.
- HTTP API: Cung cấp một giao diện API HTTP để các công cụ bên ngoài có thể tương tác với Prometheus. Giao diện này cho phép các ứng dụng khác (như Grafana hoặc các bảng điều khiển tùy chỉnh) truy vấn TSDB thông qua Động cơ PromQL và nhận kết quả dưới dạng JSON.
- Grafana / Custom Dashboards: Đây là các công cụ trực quan hóa dữ liệu. Chúng kết nối với HTTP API của Prometheus để truy vấn số liệu đo lường và hiển thị chúng dưới dạng biểu đồ, đồ thị, và bảng điều khiển trực quan trên Trình duyệt. Grafana là công cụ phổ biến nhất để trực quan hóa dữ liệu từ Prometheus.
- Rule Engine) & [Alertmanager]:
Động cơ quy tắc: Prometheus liên tục đánh giá các quy tắc (được định nghĩa trong các tệp cấu hình). Các quy tắc này có thể là:
- Quy tắc số liệu đo lường: Tạo số liệu đo lường mới dựa trên PromQL (ví dụ: tính toán tỷ lệ lỗi).
- Quy tắc cảnh báo: Định nghĩa các điều kiện cảnh báo dựa trên số liệu đo lường (ví dụ: cảnh báo nếu tỷ lệ lỗi > 5%).
Alertmanager: Khi một điều kiện quy tắc cảnh báo được đáp ứng, Prometheus sẽ gửi cảnh báo đến Alertmanager. Alertmanager là một thành phần riêng biệt quản lý việc gửi cảnh báo. Nó có thể:
- Gom cảnh báo: Nhóm các cảnh báo liên quan lại với nhau để giảm nhiễu.
- Lọc cảnh báo: Ngăn chặn hoặc bỏ qua các cảnh báo không cần thiết.
- Định tuyến cảnh báo: Gửi cảnh báo đến các kênh thông báo khác nhau như Slack, Email, PagerDuty, v.v. dựa trên cấu hình.
# metric types
Dữ liệu thô vô nghĩa nếu không được phân loại đúng cấu trúc. Prometheus định nghĩa 4 kiểu dữ liệu nền tảng. Việc hiểu rõ bản chất của chúng là tiêu chuẩn bắt buộc của một kỹ sư Backend.
| Type | Mô tả | Ví dụ |
|---|---|---|
| Counter | Chỉ tăng (reset khi restart) | Total requests, errors, bytes sent |
| Gauge | Tăng/giảm tự do | Temperature, memory usage, queue size |
| Histogram | Distribution (buckets) | Request duration, response size |
| Summary | Distribution (quantiles, client-side) | Request duration (ít dùng) |
# counter
Bản thân con số raw là vô nghĩa (ví dụ: service báo đã nhận 1 triệu requests kể từ lúc start). Thứ chúng ta cần là tốc độ thay đổi. Luôn sử dụng hàm rate() hoặc increase():
http_requests_total{method="GET", status="200"} 1234
http_requests_total{method="POST", status="500"} 5
Luôn dùng rate() hoặc increase() với counter (raw value vô nghĩa):
rate(http_requests_total[5m]) # requests/sec averaged over 5min# gauge
jvm_memory_used_bytes{area="heap"} 524288000
process_cpu_usage 0.45
Dùng trực tiếp hoặc với avg_over_time():
jvm_memory_used_bytes{area="heap"}
avg_over_time(process_cpu_usage[5m])
# histogram
Với Histogram, sức mạnh thực sự nằm ở việc tính toán bách phân vị (Percentiles) để đảm bảo SLA:
http_request_duration_seconds_bucket{le="0.01"} 100
http_request_duration_seconds_bucket{le="0.05"} 500
http_request_duration_seconds_bucket{le="0.1"}  800
http_request_duration_seconds_bucket{le="0.5"}  950
http_request_duration_seconds_bucket{le="1.0"}  990
http_request_duration_seconds_bucket{le="+Inf"} 1000
http_request_duration_seconds_sum 45.2
http_request_duration_seconds_count 1000
Tính percentiles:
histogram_quantile(0.95, rate(http_request_duration_seconds_bucket[5m]))# promql essentials
# instant vector (current values)
http_requests_total{job="order-service"}
up{job="order-service"}  # 1 = healthy, 0 = down
# range vector (values over time)
http_requests_total{job="order-service"}[5m] # last 5 minutes of samples# functions
# Rate (per-second average over range)
rate(http_requests_total[5m])

# Increase (total increase over range)
increase(http_requests_total[1h])

# Aggregation
sum(rate(http_requests_total[5m])) by (method)
avg(process_cpu_usage) by (instance)
max(jvm_memory_used_bytes) by (application)
count(up == 1) by (job)

# Percentiles
histogram_quantile(0.99, sum(rate(http_request_duration_seconds_bucket[5m])) by (le))

# Comparison
http_requests_total > 1000
rate(http_requests_total{status=~"5.."}[5m]) > 0.1

# Math
sum(rate(http_requests_total{status=~"5.."}[5m]))
/ sum(rate(http_requests_total[5m])) * 100  # error percentage

# Prediction
predict_linear(node_filesystem_free_bytes[1h], 4*3600)  # predict 4h from now
# spring boot integration (micrometer)
Khi đưa Prometheus vào hệ sinh thái Java/Spring Boot (đặc biệt khi dùng Java 21 và các framework hiện đại), Micrometer đóng vai trò là "facade" che giấu đi sự phức tạp của hệ thống giám sát bên dưới.
# dependencies
<dependency>
   <groupId>io.micrometer</groupId>
   <artifactId>micrometer-registry-prometheus</artifactId>
</dependency>
<dependency>
   <groupId>org.springframework.boot</groupId>
   <artifactId>spring-boot-starter-actuator</artifactId>
</dependency>
# config
Cấu hình tối giản nhưng thực dụng (application.yml):
management:
  endpoints:
    web:
      exposure:
        include: health, prometheus
  metrics:
    tags:
      application: ${spring.application.name}
    distribution:
      percentiles-histogram:
        http.server.requests: true # Bật tính năng chia bucket cho HTTP requests
      sla:
        http.server.requests: 50ms, 100ms, 200ms, 500ms, 1s # Định hình các bucket theo SLA kỳ vọng
# custom metrics
Đừng chỉ giám sát hạ tầng. Hãy đưa metrics vào sâu trong core domain để đo lường nhịp đập của business.
@Service
public class OrderService {

   private final Counter orderCounter;
   private final Timer orderProcessingTimer;
   private final Gauge activeOrdersGauge;

   public OrderService(MeterRegistry registry) {
       // Đặt tên metrics theo chuẩn phân cấp rõ ràng
       this.orderCounter = Counter.builder("orders.created.total")
           .description("Total orders created")
           .tag("type", "standard")
           .register(registry);

       this.orderProcessingTimer = Timer.builder("orders.processing.duration")
           .description("Order processing time")
           .publishPercentiles(0.5, 0.95, 0.99) // Quan tâm đến p95 và p99
           .register(registry);

       this.activeOrdersGauge = Gauge.builder("orders.active.count",
               activeOrders, AtomicInteger::get)
           .description("Currently active orders")
           .register(registry);
   }

   public Order createOrder(OrderRequest request) {
       return orderProcessingTimer.record(() -> {
           Order order = processOrder(request);
           orderCounter.increment();
           return order;
       });
   }
}
# prometheus config
Một hệ thống alert chuẩn mực không phải là hệ thống réo chuông liên tục trên Slack. Sự nhiễu loạn thông tin (alert fatigue) sẽ giết chết phản xạ của kỹ sư. Hãy áp dụng tư duy tối giản: Chỉ lên tiếng khi thực sự cần thiết.
- lert trên Symptoms, không phải Causes: Cảnh báo khi "Tỉ lệ lỗi thanh toán vượt quá 5%" thay vì "CPU của DB node 3 tăng cao". End-user không quan tâm đến CPU, họ quan tâm đến việc giao dịch thất bại.
- Tránh các cảnh báo thoáng qua (Flapping): Luôn dùng mệnh đề for để đảm bảo tình trạng lỗi phải duy trì đủ lâu.
# prometheus.yml
global:
  scrape_interval: 15s
  evaluation_interval: 15s

scrape_configs:
  - job_name: 'spring-boot-apps'
    metrics_path: /actuator/prometheus
    eureka_sd_configs:
      - server: http://discovery:8087/discovery/eureka
    relabel_configs:
      - source_labels: [__meta_eureka_app_name]
        target_label: application
      - source_labels: [__meta_eureka_app_instance_metadata_management_port]
        target_label: __metrics_path__
        replacement: /actuator/prometheus

  - job_name: 'node-exporter'
    static_configs:
      - targets: ['node-exporter:9100']

  - job_name: 'postgres-exporter'
    static_configs:
      - targets: ['postgres-exporter:9187']
# alerting rules
# alert-rules.yml
groups:
  - name: service-alerts
    rules:
      - alert: HighErrorRate
        expr: sum(rate(http_server_requests_seconds_count{status=~"5.."}[5m])) by (application) / sum(rate(http_server_requests_seconds_count[5m])) by (application) > 0.05
        for: 5m
        labels:
          severity: critical
        annotations:
          summary: 'High error rate on {{ $labels.application }}'
          description: 'Error rate is {{ $value | humanizePercentage }}'

      - alert: HighLatency
        expr: histogram_quantile(0.95, sum(rate(http_server_requests_seconds_bucket[5m])) by (le, application)) > 2
        for: 5m
        labels:
          severity: warning
        annotations:
          summary: 'High p95 latency on {{ $labels.application }}'

      - alert: ServiceDown
        expr: up == 0
        for: 1m
        labels:
          severity: critical
        annotations:
          summary: '{{ $labels.job }} is down'

      - alert: HighMemoryUsage
        expr: jvm_memory_used_bytes{area="heap"} / jvm_memory_max_bytes{area="heap"} > 0.9
        for: 5m
        labels:
          severity: warning
        annotations:
          summary: 'High heap usage on {{ $labels.application }}'
# alertmanager
# alertmanager.yml
route:
  receiver: 'slack-critical'
  group_by: ['alertname', 'application']
  group_wait: 30s
  group_interval: 5m
  repeat_interval: 4h
  routes:
    - match:
        severity: critical
      receiver: 'slack-critical'
    - match:
        severity: warning
      receiver: 'slack-warning'

receivers:
  - name: 'slack-critical'
    slack_configs:
      - channel: '#alerts-critical'
        send_resolved: true
        title: '{{ .GroupLabels.alertname }}'
        text: '{{ range .Alerts }}{{ .Annotations.description }}{{ end }}'

  - name: 'slack-warning'
    slack_configs:
      - channel: '#alerts-warning'
        send_resolved: true
# key metrics to monitor (spring boot)
# Service health
up{application="order-service"}

# Request rate
sum(rate(http_server_requests_seconds_count{application="order-service"}[5m])) by (method, uri)

# Error rate
sum(rate(http_server_requests_seconds_count{application="order-service", status=~"5.."}[5m]))

# Latency percentiles
histogram_quantile(0.95, sum(rate(http_server_requests_seconds_bucket{application="order-service"}[5m])) by (le))

# JVM
jvm_memory_used_bytes{application="order-service", area="heap"}
jvm_gc_pause_seconds_sum
jvm_threads_live_threads

# Connection pools
hikaricp_connections_active{pool="HikariPool-1"}
hikaricp_connections_pending{pool="HikariPool-1"}

# RabbitMQ consumer
rabbitmq_consumed_total
spring_rabbitmq_listener_seconds_count
# storage & retention
# Command line flags
--storage.tsdb.retention.time=30d    # keep 30 days
--storage.tsdb.retention.size=50GB   # or max 50GB
--storage.tsdb.path=/prometheus/data
Long-term storage: Thanos, Cortex, hoặc Prometheus remote write.
# best practices
Để hệ thống giám sát không trở thành gánh nặng cho chính hạ tầng của bạn, hãy ghi nhớ các tiêu chuẩn sau:
- Quản trị Label Cardinality: Đừng bao giờ ném những dữ liệu có tính unique cao (như user_id, email, request_id) vào label của Prometheus. Số lượng tổ hợp label bùng nổ sẽ làm crash TSDB do cạn kiệt RAM.
- Chu kỳ Scrape hợp lý: 15s đến 30s là con số tiêu chuẩn. Đừng set 1s chỉ vì muốn thấy biểu đồ chạy "mượt".
- Cửa sổ tính toán Rate: Nguyên tắc ngầm định là Time Window truyền vào hàm rate() (ví dụ [5m]) phải lớn hơn ít nhất 4 lần so với scrape_interval.
- Kiến trúc Lưu Trữ Dài Hạn: Prometheus thiết kế để giữ data ngắn hạn (local disk). Đừng bắt nó ôm dữ liệu của 1 năm. Nếu cần lưu trữ historical data để phục vụ report, hãy đẩy data ra ngoài bằng cơ chế Remote Write tới Thanos, Cortex hoặc VictoriaMetrics.
Observability không chỉ là việc vẽ ra những biểu đồ hoa mỹ. Đó là nghệ thuật thấu hiểu nội tâm của hệ thống, lắng nghe những tiếng thì thầm của dữ liệu trước khi chúng biến thành những tiếng gào thét của sự cố.
Chỉ là những ghi chép cá nhân với hy vọng mang lại chút giá trị. Nếu thấy hữu ích, đừng ngại chia sẻ cho bạn bè & đồng nghiệp nhé!
Happy coding 😎 👍🏻 🚀 🔥.
On this page
- # bản chất
- # kiến trúc
- # metric types
- # counter
- # gauge
- # histogram
- # promql essentials
- # instant vector (current values)
- # range vector (values over time)
- # functions
- # spring boot integration (micrometer)
- # dependencies
- # config
- # custom metrics
- # prometheus config
- # alerting rules
- # alertmanager
- # key metrics to monitor (spring boot)
- # storage & retention
- # best practices